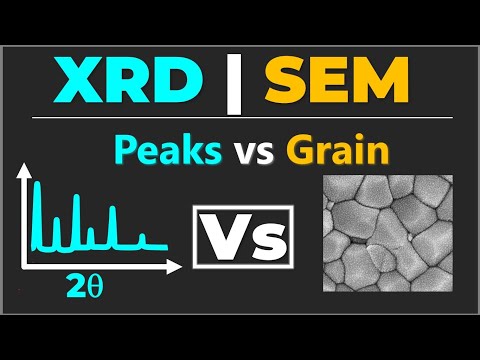
Peak intensity in XRD is often misunderstood. It’s not the peak height — it’s the total area under the peak, and it reveals how atoms are arranged inside the crystal. This video explains what controls XRD peak intensity and why I ∝ |Fₕₖₗ|² is the key to interpreting diffraction patterns correctly. Peak intensity (the y-axis in an XRD plot) carries important information about the crystal chemistry, atomic arrangement, and structural order in a material. While most beginners look only at peak height, the real physics comes from the structure factor, which depends on the type and position of atoms inside the unit cell. In this video, you will learn: • Why peak intensity depends on atomic number (Z) and scattering power • How atomic positions (x, y, z) influence the structure factor • Why well-oriented or larger crystallites give stronger peaks • Why preferred orientation changes the intensity ratio • Why two samples with identical peak positions can still have very different peak intensities Structure factor formula: Fₕₖₗ = Σ fᵢ · exp[2πi(hxᵢ + kyᵢ + lzᵢ)] and intensity follows: I ∝ |Fₕₖₗ|² This means the intensity of each XRD peak directly reflects: • Types of atoms (scattering factor fᵢ) • Their coordinates inside the unit cell • The symmetry and arrangement of the crystal Peak intensity helps determine: • Crystal chemistry and composition • Presence of heavy vs. light atoms • Preferred orientation (texture) • Degree of crystallinity • Structural differences between phases If you want to correctly interpret XRD patterns, especially for nanomaterials, thin films, or mixed-phase samples, understanding peak intensity is essential. #XRD #MaterialsScience #Nanotechnology #Crystallography #ResearchTutorial
- 3758Просмотров
- 1 год назадОпубликованоNano SPEAKs
Peak Intensity in XRD Explained | Not Just Peak Height!
Похожее видео


Популярное
Новини