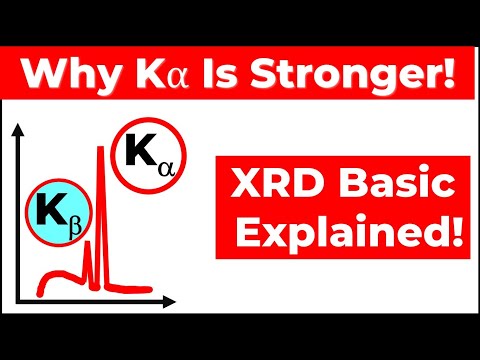
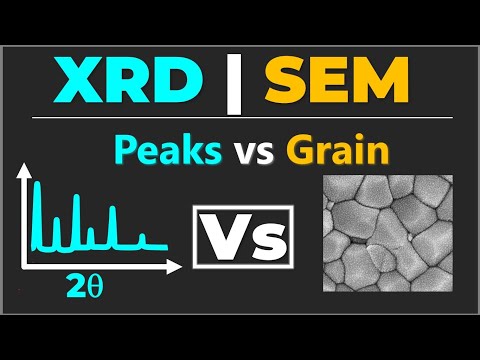
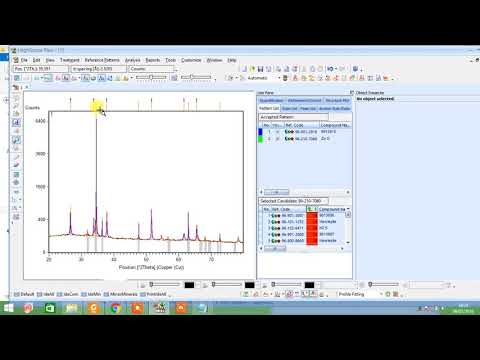
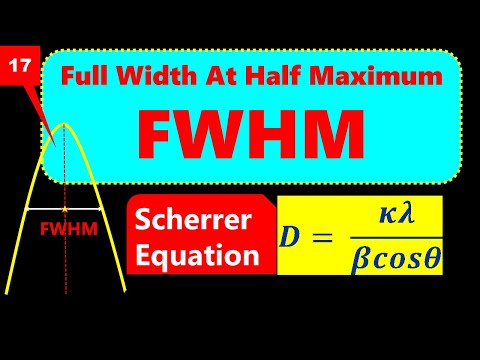
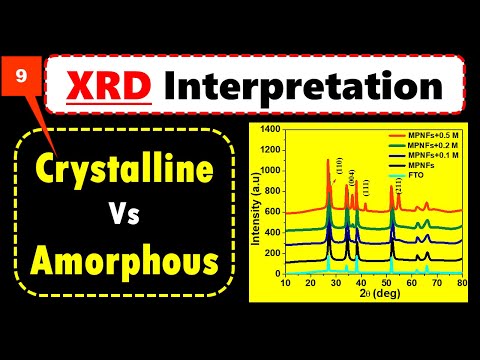
Understanding XRD peaks is the key to analyzing crystalline materials. In this video, you’ll learn how peak position, peak intensity, and peak shape reveal structure, phase purity, crystallinity, grain size, defects, and more. I explain each part of the XRD pattern with clear examples so you can interpret your diffraction data with confidence. This is ideal for students, researchers, and anyone working with materials, thin films, polymers, ceramics, or nanomaterials. What you’ll learn: • How peak position relates to crystal structure • Why intensity changes with phase composition • How FWHM and peak shape reflect crystallite size and strain • How to avoid common mistakes in XRD interpretation If you work in materials science, chemistry, physics, or nanotechnology, this breakdown will help you understand your XRD plots faster and with more accuracy. #XRDAnalysis #MaterialsScience #Crystallography #ResearchSkills
- 3944Просмотров
- 7 месяцев назадОпубликованоNano SPEAKs
XRD Peak Analysis Explained: Position, Intensity, and Shape Made Simple
Похожее видео


Популярное
Новини