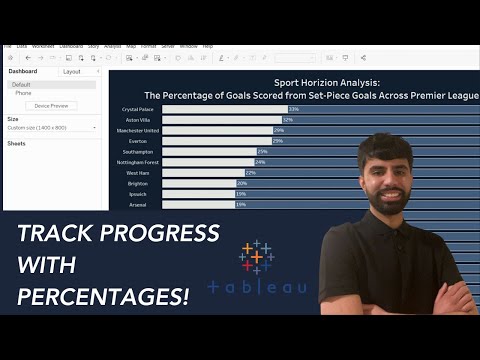
Effective data visualisation is essential for analysing performance in football. In this tutorial, Jay Binning from Sport Horizon demonstrates how to create Butterfly Charts in Tableau, a powerful method for comparing two sets of performance data side by side. Butterfly charts are particularly useful for analysing player statistics, team performances, and match trends, enabling sport scientists and performance analysts to identify key differences and patterns with clarity. Whether assessing physical outputs, technical metrics, or tactical KPIs, this approach provides valuable insights to support data-driven decision-making. 🔹 No advanced Tableau experience required – this step-by-step guide is accessible for all levels of expertise! 🚀 Welcome to the Sport Horizon YouTube Channel! 🚀 At Sport Horizon, we’re dedicated to helping you excel in sports data. Our videos offer tips, tutorials, and insights on Power BI, Tableau, Chat GPT, and more, tailored for those working in sports performance and analytics. 🔔 Don’t forget to subscribe and hit the bell icon to stay updated with our latest videos! 🔗 Connect with us: • Website: • LinkedIn: • Twitter: • 📧 For business inquiries: info@ #Tableau #PowerBI #SportsAnalytics #DataVisualisation #SportHorizon #SportScience #BespokeInsights #PerformanceAnalysis #DataAnalytics #DataAnalysis #Football #Soccer #GAA #Excel
- 276Просмотров
- 8 месяцев назадОпубликованоSport Horizon
How to Create Butterfly Charts | Tableau for Sport
Похожее видео


Популярное
Новини