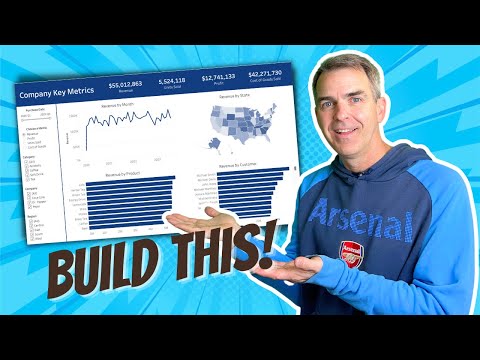
Build this awesome interactive #Tableau dashboard in just 10 minutes. ---------- At Next-Level Tableau, I help analysts at all skill levels master Tableau, gain confidence in their abilities, and open doors to bigger career opportunities. Through my live and on-demand training, I’ve helped thousands of analysts sharpen their skills—whether they’re just starting out or looking to become top-tier professionals recognized in their industry. Learn more here: ---------- In this video, we'll build a dynamic Tableau dashboard from scratch in just 10 minutes. This will be a sales dashboard for Superstore’s European region. 1️⃣ We’ll create all of the charts which include a map, bar chart, line chart, and KPIs. 2️⃣ We’ll customize the charts to fit our style. 3️⃣ We’ll place the charts on the dashboard using layout containers, padding, formatting and more. 4️⃣ We’ll add interactivity to the dashboard to make for a great user experience. Chapters: 0:00 Intro 1:00 Build the KPIs 2:45 Build the map 3:40 Build the line chart 5:25 Build the bar chart 6:54 Put it all together in a Dashboard using Containers 10:31 Add interactivity to the dashboard ---------- To go deeper, check out my courses: → Tableau Starter Kit - A beginner-friendly course designed to help you understand Tableau quickly - → Tableau Core Concepts - A comprehensive, self-paced course for Tableau users ready to level up - → Join Next-Level Tableau - My most comprehensive Tableau program to help analysts become industry leaders, with the support of a like-minded community, and 1-to-1 help from me - 📩 NEWSLETTER Each week, I'll send you Tableau tips, tutorials, and strategies to design better dashboards, have more impactful, and stand out in your career: 🔽 CONNECT WITH ME • Official website - • LinkedIn - / andykriebel =============== ⏬ DOWNLOAD the data and starter and solution workbooks. I would appreciate your support with a small donation to continue to make videos for you. Data & workbook:
- 456896Просмотров
- 2 года назадОпубликованоAndy Kriebel
Make an AWESOME Tableau Dashboard in Only 10 Minutes
Похожее видео


Популярное
Новини