Master graphing linear inequalities with this comprehensive tutorial from Mario's Math Tutoring! This video presents two effective methods—the Test Point Method and the Shading Rule Method—so you can choose the approach that best suits your learning style. Learn how to graph inequalities in both slope-intercept form (y = mx + b) and standard form (Ax + By = C), understanding when to use dashed versus solid lines. We'll walk through three detailed examples, including crucial tips like flipping the inequality sign when dividing by a negative number. Perfect for algebra students looking to confidently visualize and solve linear inequalities! Timestamps: 0:00 - Introduction to Graphing Linear Inequalities 0:20 - Understanding Inequality Signs (Less Than, Greater Than) 0:35 - Graphing Method 1: Slope-Intercept Form (y = mx + b) 1:05 - Dashed vs. Solid Lines for Inequalities 1:30 - Method 1: Test Point Method Explained (Example 1) 2:40 - Method 2: Shading Rule Method Explained (Y is Less Than/Greater Than) 3:20 - Graphing Method 2: Standard Form (Ax + By = C) 3:45 - Using X and Y Intercepts for Standard Form 4:30 - Alternative: Converting Standard Form to Slope-Intercept Form 5:20 - Example 2: Graphing 6:20 - When to Avoid the Origin as a Test Point 6:55 - Example 3: Graphing 7:55 - CRUCIAL TIP: Flipping the Inequality Sign 9:00 - Verifying Shading with Both Methods 9:40 - Conclusion and More Practice * Organized List of My Video Lessons to Help You Raise Your Scores & Pass Your Class. Videos Arranged by Math Subject as well as by Chapter/Topic. (Bookmark the Link Below) ➡️JOIN the channel as a CHANNEL MEMBER at the "ADDITIONAL VIDEOS" level to get access to my math video courses(Algebra 1, Algebra 2/College Algebra, Geometry, and PreCalculus), midterm & final exam reviews, ACT and SAT prep videos and more! (Over 390+ videos)
- 4045Просмотров
- 1 год назадОпубликованоMario's Math Tutoring
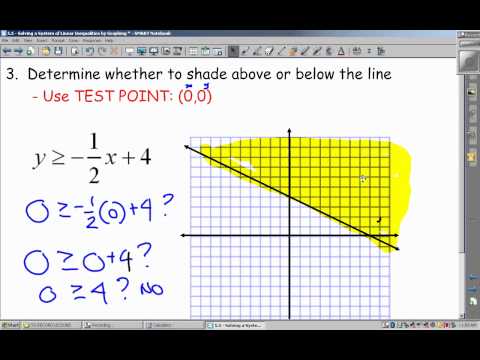
Master Graphing Inequalities: Test Point & Shading Rules
Похожее видео


Популярное
Новини