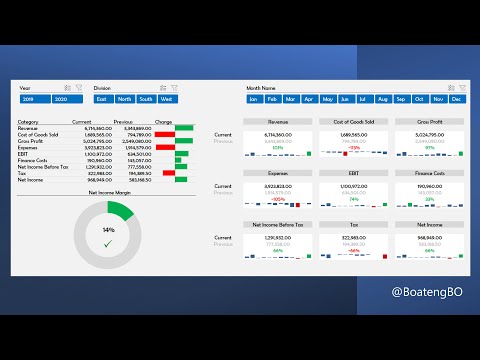
This is a complete dashboard lesson on how to create an Income Statement Dashboard in Power BI that compares two years of financials. From a simple journal and chart of accounts, we will Transform and shape these data sets using Power Query, Create a Data Model in Power BI Visualize the Income Statement in Power BI. The workbook with the sample data can be downloaded here: Chapters 0:00 Introduction 0:47 Overview 3:03 ETL with Power Query 15:54 Create your Data Model 17:20 Measures 28:34 Income Statement Visual 43:03 Net Income Margin Visual 49:42 Current Previous Visuals 1:09:51 Slicers and Conclusion Join our Power BI Training in Ghana by applying here
- 77774Просмотров
- 2 года назадОпубликованоFinex Skills Hub
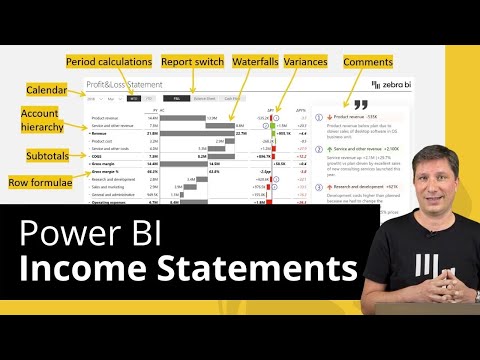
Create an Income Statement Dashboard in Power BI to compare two years of Financials
Похожее видео


Популярное
Новини