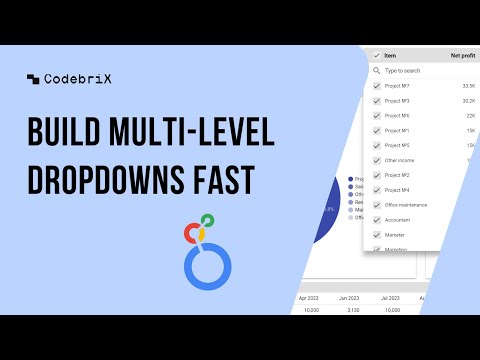
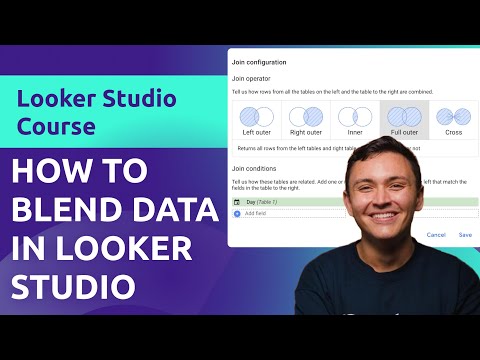
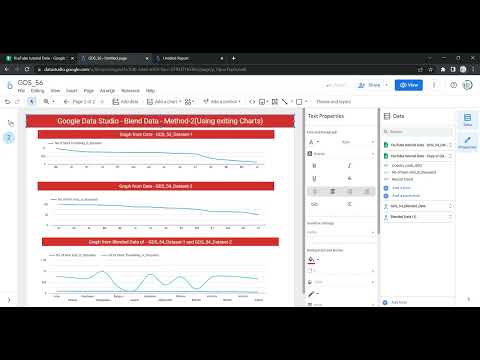
Unlock a game-changing technique in data analysis with Looker Studio - turn multiple sources into a cohesive, powerful report In this comprehensive tutorial, we’ll guide you through the essentials of data blending to combine fields from multiple data sources into meaningful visualizations. Using a real-world example, you’ll see how to merge a project dataset with technology details efficiently. We’ll cover: - The basics of data blending and its importance - Adding and managing blended data - Setting up joins, including Left Outer, Right Outer, Inner, and Full Outer - Practical demonstrations with step-by-step instructions Key moments of the video: 0:00 - Introduction to Data Blending 0:23 - Example Overview and Setting Up Data Blending 1:43 - Choosing Dimensions, Metrics, and Joining Tables 3:20 - Exploring Join Types and Key Connections 5:17 - Using Blended Data in Charts and Observing Results 8:27 - Final Remarks Don’t forget to like, subscribe, and share for more Looker Studio tips! #DataBlending #LookerStudio #LookerStudioTutorial #DataVisualization #GoogleDataStudio #TechTutorials #DataAnalysis
- 3162Просмотров
- 1 год назадОпубликованоCodebriX
How to Blend Data in Looker Studio: Practical Examples
Похожее видео


Популярное
Новини