Sign up for our Excel webinar, times added weekly: This is part 2 in the series on an introduction to pivot tables and dashboards. In this video I explain some of the different pivot table calculation types. Learn how to calculate the average, count, sum, and percentage of total. I explain how to update your pivot table with more data, and also how to refresh your pivot tables. The video contains a lot of Excel tips, like how to quickly make a duplicate copy of a sheet, how to select the visible cells only, and a lot of useful keyboard shortcuts. I also demonstrate how to filter your source data and build a pivot table from your source data sheet using the PivotPal add-in. Lots of fun stuff to learn!!! Download the files to follow along at the following link. WATCH PART 1: WATCH PART 3: Get PivotPal: Subscribe to my free newsletter: 00:00 Introduction 00:39 Creating a duplicate pivot table 03:18 Average unit price 04:25 Count of orders 04:52 Blank rows 05:52 Refresh pivot table 06:25 Calculate revenue percentage 07:27 Whos selling in categories 08:41 Adding more data 09:20 Updating the pivot table 10:50 Filtering the source data 12:51 Building out your pivot table
- 3229138Просмотров
- 1 десятилетие назадОпубликованоExcel Campus - Jon
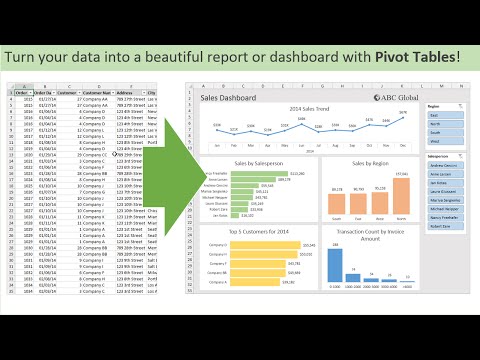
Introduction to Pivot Tables, Charts, and Dashboards (Part 2)
Похожее видео


Популярное
Новини