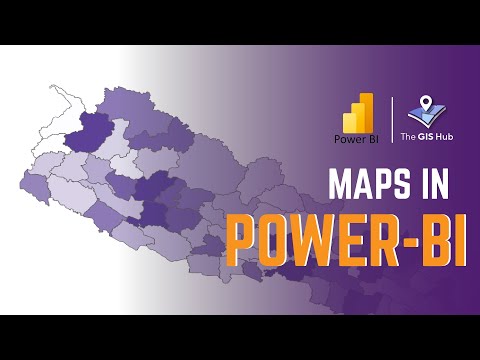
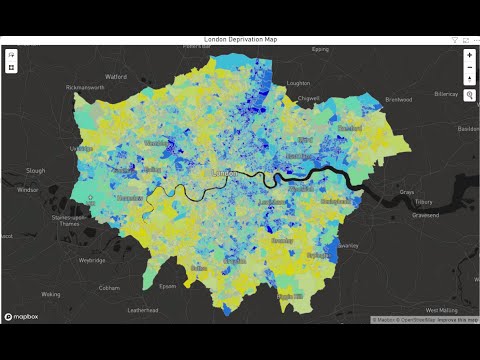
We explain how to build build shape (choropleth) maps in Power BI using example maps of UK election results and deprivation in south London. This video is part of the "Solving Analytical Challenges in Power BI" from the London Business Analytics Group (LBAG). These are short summaries of weekly live events that LBAG is running during the lockdown while we can't meet in person. All our events are listed at Please join us. The datasets and course materials are in at %20Shape%20Maps%20In%20Power%20BI We run a full range of data analysis and generative AI courses in London and online. See our courses at
- 73498Просмотров
- 5 лет назадОпубликованоLondon Business Analytics Group
Creating Shape Maps In Power BI
Похожее видео


Популярное
Новини