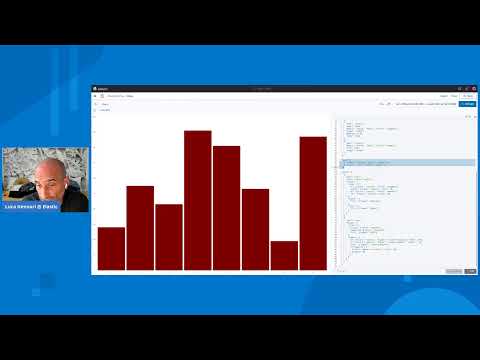
Welcome to StackTrekker! In this advanced Kibana tutorial, I’ll show you how to create powerful visualizations that go beyond the basics. You'll learn how to work with complex datasets, apply filters and aggregations, and build interactive dashboards that give deeper insights into your Elasticsearch data. Whether you're analyzing logs, metrics, or custom data—this hands-on guide will level up your data visualization skills using Kibana. 🔹 What You’ll Learn: ✅ How to use Lens visualizations ✅ How to apply filters and advanced aggregations ✅ How to customize dashboards for different use cases ✅ How to use drilldowns and interactive controls 📌 Previous Tutorials: Part #1: Part #2: Part #3: Part #4: 🔹 Config Files and Datasets Used in This Video: 🎯 Why Use Kibana for Advanced Visualizations? 🔹 Real-time insights from structured and unstructured data 🔹 Fully interactive and customizable dashboards 🔹 Works seamlessly with Elasticsearch data 🔹 Ideal for monitoring, reporting, and anomaly detection #Kibana #Elasticsearch #DataVisualization #StackTrekker #DevOps #KibanaTutorial #ELKStack #Observability #BigData #Dashboarding #ElasticStack #Vega #TSVB #DataAnalytics #SystemMonitoring #ВизуализацияДанных #Аналитика #DevOpsRU #Наблюдаемость #KibanaDE #Visualisierung #Datenanalyse #SoftwareEntwicklung #DevOpsDE 🔔 Subscribe & Turn on Notifications to stay updated with my latest programming tutorials! 👍 Like, comment, and share if you found this helpful!
- 1103Просмотров
- 8 месяцев назадОпубликованоStackTrekker
Kibana: Advanced Visualizations Explained | ELK Stack Tutorial
Похожее видео


Популярное
Новини