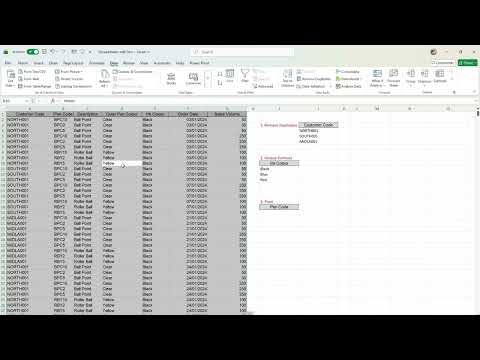
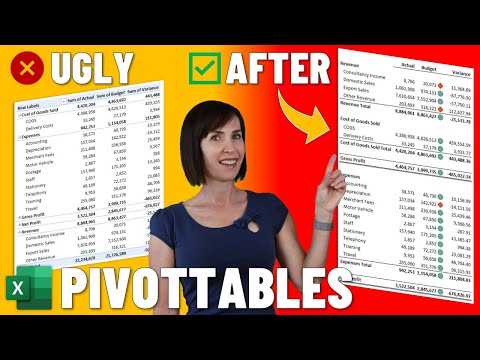
📈 How to Use Pivot Tables in Excel | Step-by-Step Tutorial for Beginners Feeling overwhelmed by massive Excel sheets? Learn how to transform messy data into clear insights using Pivot Tables. In this tutorial, I’ll walk you through every step — from preparing your data to building dynamic, interactive reports that reveal exactly which products, stores, and countries drive your sales. 🧭 What You’ll Learn: * How to prepare your data for Pivot Tables * Insert and format Pivot Tables the right way * Use Pivot Table fields to analyze sales, stores & countries * Format numbers and currencies professionally * Add grand totals, percentages, and quick insights * Create interactive dashboards using slicers * Before vs After: messy dataset → clean, interactive report 💡 Perfect For: * Excel beginners and data analysts * Students and professionals working with business reports * Anyone who wants to save time and uncover insights fast If this helped you, like 👍, subscribe 🔔, and comment below —👉 What’s the first insight you’ll create with your Pivot Table? 🕒 Timestamps 00:00:00 Intro 00:01:06 Step 1: Prepare Your Data 00:01:53 Step 2: Insert Pivot Table 00:02:39 Step 3: Explore Pivot Fields 00:03:48 Step 4: Format and Cleanup 00:04:54 Step 5: Add more insights 00:06:23 Step 6: Slicers Practice Excel File: #Excel #PivotTable #ExcelTutorial #ExcelForBeginners #DataAnalysis #ExcelTips #MicrosoftExcel #ExcelDashboard #ExcelTraining #BusinessAnalytics
- 36Просмотров
- 1 месяц назадОпубликованоBillRosk
How to use pivot tables in excel | Step by Step Tutorial
Похожее видео


Популярное
Новини