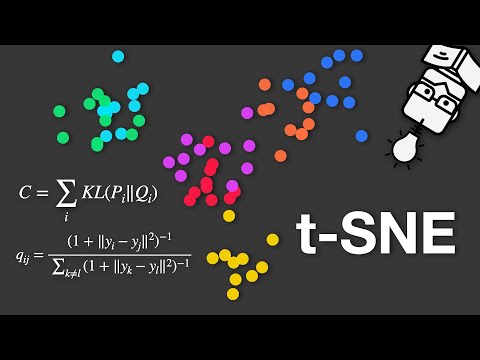
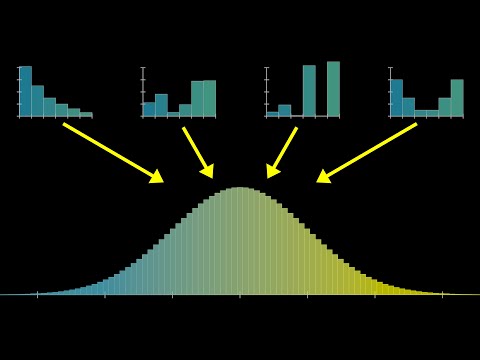
t-SNE is a popular method for making an easy to read graph from a complex dataset, but not many people know how it works. Here's the inside scoop. Here’s how to create a t-SNE graph in R (this is copied from the help file for Rtsne)… library("Rtsne") iris_unique <- unique(iris) # Remove duplicates iris_matrix <- (iris_unique[,1:4]) (42) # Set a seed if you want reproducible results tsne_out <- Rtsne(iris_matrix) # Run TSNE # Show the objects in the 2D tsne representation plot(tsne_out$Y,col=iris_unique$Species) This StatQuest is based on the original t-SNE manuscript, and it's not super hard to read (especially if you understand the general idea of how it works): For a complete index of all the StatQuest videos, check out: If you'd like to support StatQuest, please consider... Patreon: ...or... YouTube Membership: ...buying one of my books, a study guide, a t-shirt or hoodie, or a song from the StatQuest store... ...or just donating to StatQuest! Lastly, if you want to keep up with me as I research and create new StatQuests, follow me on twitter: 0:00 Awesome song and introduction 1:19 Overview of what t-SNE does 2:24 Overview of how t-SNE works 4:12 Step 1: Determine high-dimensional similarities 9:26 Step 2: Determine low-dimensional similarities 10:33 Step 3: Move points in low-d 11:05 Why the t-distribution is used instead of the normal distribution Corrections: 6:17 I should have said that the blue points have twice the density of the purple points. 7:08 There should be a in the denominator, not a 0.5. #statquest #tsne
- 542891Просмотров
- 8 лет назадОпубликованоStatQuest with Josh Starmer
StatQuest: t-SNE, Clearly Explained
Похожее видео


Популярное
Новини