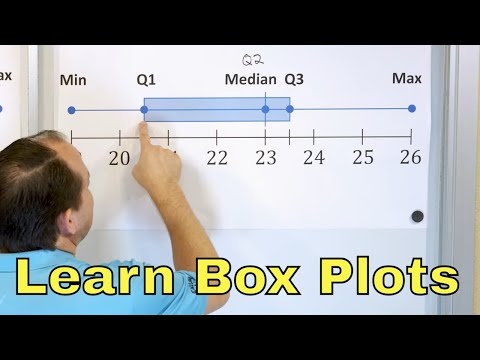
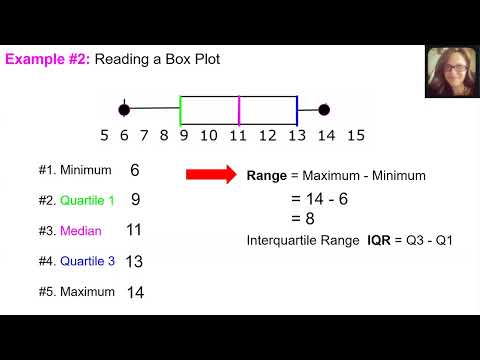
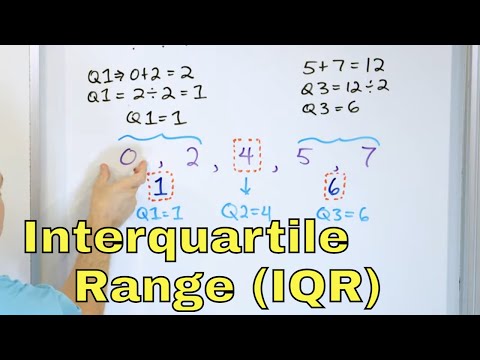
Learn all about box plots in this comprehensive IXL tutorial! Box plots, also known as box-and-whisker plots, are powerful tools for visualizing data sets. This video covers everything you need to know, including: Understanding the five key components of a box plot: minimum, maximum, median, lower quartile (Q1), and upper quartile (Q3) How to calculate the range and interquartile range (IQR) Using box plots to analyze real-world problems, like comparing data sets and interpreting variability Whether you're studying statistics, preparing for a math test, or just curious about data visualization, this video will guide you step-by-step through key concepts with clear examples. By the end, you'll feel confident tackling questions about box plots and interpreting their meaning. 00:00 Intro 00:28 Minimum 00:38 Maximum 00:48 Median 01:01 Lower Quartile 01:15 Upper Quartile 01:29 Parts of the Box 01:52 Range 02:11 Interquartile Range 02:48 Example 1 - Find percent and range 03:34 Example 2 - Find median and range 04:28 Summary
- 19291Просмотров
- 9 месяцев назадОпубликованоIXL
Box Plots Explained: Learn How to Interpret and Analyze Data Easily
Похожее видео


Популярное
Новини