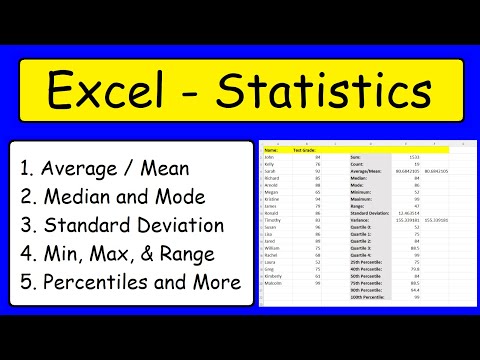
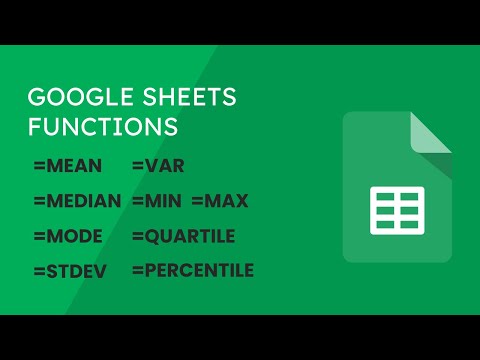
Descriptive Statistics Formulas in Excel | Mean Median Mode Standard Deviation Percentile Quartile Learn how to calculate Descriptive Statistics in Excel with this comprehensive tutorial! In this video, I explain the most important statistical formulas, including: Mean: Calculate the average value of your dataset. Median: Find the middle value in sorted data. Mode: Identify the most frequently occurring value. Standard Deviation: Measure data variability. Percentile & Quartile: Understand data distribution and ranks. This step-by-step guide will help you analyze data easily and accurately, whether you're a student, researcher, or professional. Master these Excel formulas today and simplify your statistical calculations! #DescriptiveStatistics #ExcelFormulas #dataanalysis Chapters 0:00 - 0:23 Intro 0:24 - 0:42 Average Function 0:43 - 1:38 Median Function 1:39 - 2:52 Mode Function 2:53 - 3:33 STDEV Function 3:34 - 3:54 VAR Function 3:55 - 4:36 Range: MIN & MAX Function 4:37 - 6:15 Range: Quartile Function 6:16 - 7:12 Range: Percentile Function 7:13 - 8:52 Range: Data Analysis Tool to get easy statistics
- 261Просмотров
- 11 месяцев назадОпубликованоSirexcelco
Calculate Mean Median Mode Standard Deviation Percentile | Descriptive Statistics Formulas in Excel
Похожее видео


Популярное
Новини