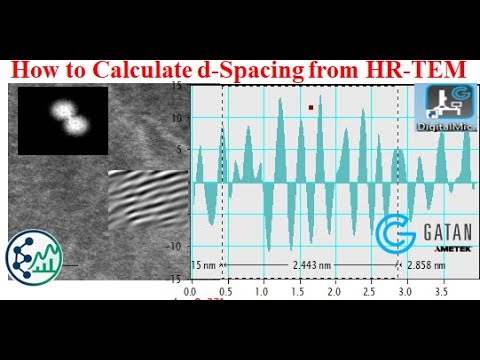
In this tutorial, I’ll guide you step by step on how to calculate d-spacing from HR-TEM images using ImageJ software, and then show you how to visualize the interplanar spacing directly on your TEM images using PowerPoint or Microsoft Paint. 👉 If this tutorial helps, don’t forget to Like, Comment, and Subscribe for more content on: ▶️ WATCH NEXT – RELATED TUTORIALS: • Plotting in OriginPro: o Plot Single XRD Pattern: o Plot Multiple XRD Spectra: o Plot FTIR Spectra: o Plot UV-Visible Spectra: o Plot TGA-DTA Data: o Bar Graph with Error Bars: o Reusability/Recycling Graph: o Draw Degradation Mechanism (PowerPoint): o How to Convert XRD Raw Data to ASC Format: o How to Plot Multiple FTIR Spectra in One Graph Using Origin: o How to Plot Multiple XRD Spectra in One Graph: o How to Convert XRD Raw Data to ASC Format: o How to Label XRD Peaks with Miller Indices (hkl) using X’Pert HighScore:
- 949Просмотров
- 3 месяца назадОпубликованоNano Analysis Hub
How to Calculate d-Spacing from HR-TEM Images using ImageJ | Show Interplanar Spacing on TEM #17
Похожее видео


Популярное
Новини