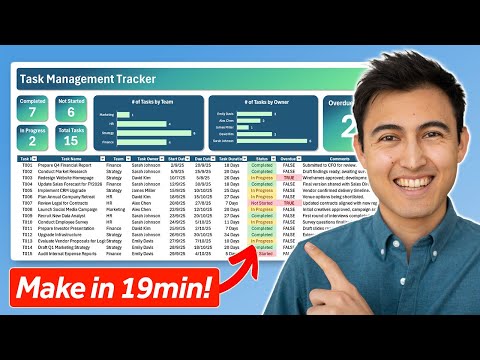
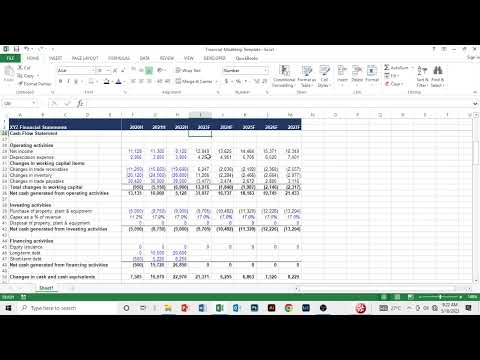
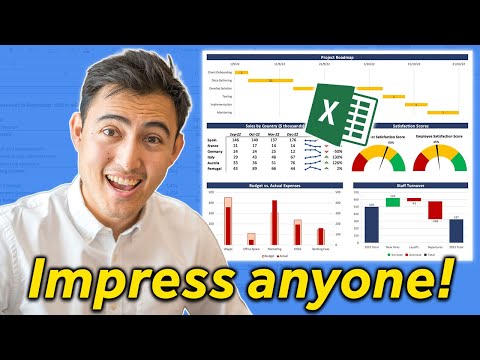
Learn to build a beautiful, dynamic, and professional financial dashboard in Excel from scratch. In this in-depth tutorial, Tim Vipond, CEO of CFI, guides you step-by-step through creating a polished, one-page report that effectively communicates complex financial information. You'll master advanced charting techniques and pro-level tricks to make your dashboards stand out, including how to build a "football field" valuation chart and use the Excel Camera tool for live-linked charts. 📊 Download the FREE Excel File to Follow Along: In this tutorial, you will learn how to: 🔹 Structure a professional dashboard layout using Page Break Preview. 🔹 Create and format a Pie Chart to visualize revenue by segment. 🔹 Use the Excel Camera Tool to create a dynamic, live-linked stock price chart. 🔹 Build a complex Football Field Chart using a stacked bar and scatter plot combo to show valuation ranges. 🔹 Design a Stacked Column Chart to display revenue trends over time. 🔹 Create an advanced Combo Chart to overlay Year-over-Year (YoY) growth on a secondary axis. 🔹 Add a Line Chart to track key metrics like EBITDA, Free Cash Flow, and Net Income. ✅ Ready to master advanced Excel and data visualization? This tutorial is a sample of the practical, hands-on training in CFI's certification programs. Gain the skills to build sophisticated business intelligence tools that drive major decisions. ► Learn More & Explore CFI Certifications: TUTORIAL CHAPTERS 🔹 [00:00] Dashboard Preview & Setting Up the File 🔹 [01:05] Adding a "Company Description" Text Box 🔹 [01:40] Chart 1: Pie Chart (Revenue by Segment) 🔹 [02:45] Formatting the Pie Chart & Legend 🔹 [03:43] Pro Tip: Using the Excel Camera Tool 🔹 [05:00] How the Camera Tool Creates a Live-Linked Chart 🔹 [05:40] Chart 2: Football Field Chart (Valuation) 🔹 [06:05] Building the Chart with a Stacked Bar (The Trick) 🔹 [08:45] Adding an Average Line (Combo Chart: Bar + Scatter) 🔹 [11:06] Formatting the Football Field Chart Labels 🔹 [12:40] Chart 3: Stacked Column Chart (Revenue Over Time) 🔹 [15:28] Pro Tip: Adding YoY% Growth (Combo Chart) 🔹 [16:04] Using a Secondary Axis for Growth Rates 🔹 [17:57] Chart 4: Line Chart (EBITDA, FCF, Net Income) 🔹 [19:22] Final Review & Page Break Preview 🔹 [19:40] Conclusion & Download the File #ExcelDashboard #ExcelTutorial #DataVisualization #FinancialDashboard #Excel #Finance #BusinessIntelligence #ExcelCharts #FootballFieldChart #ExcelTips #CFI
- 678Просмотров
- 4 дня назадОпубликованоCorporate Finance Institute
Excel Dashboard Tutorial: From Scratch to Professional Report with Tim Vipond
Похожее видео


Популярное
Новини